The dashboard includes the following widgets that display playback information.
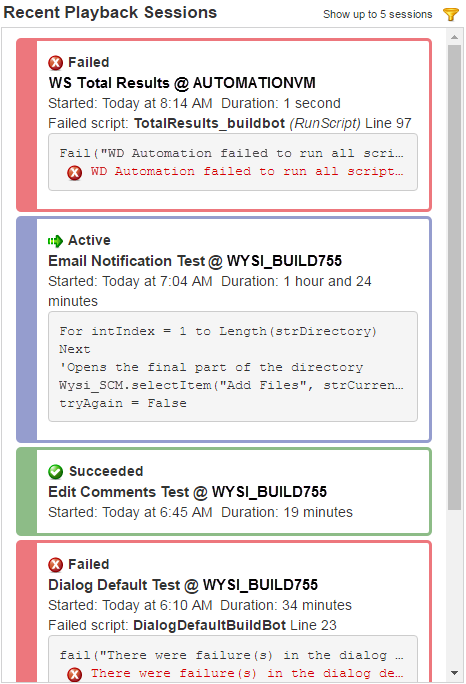
Displays an overview of the most recent playback sessions. Use this widget to quickly see the status of sessions during or after playback. For example, you can see which scripts failed during an automated regression test to report issues in a new build.
Each session summary includes the current run state, session name (if provided), computer it ran on, when it started, and how long it ran. Active, canceled, and inactive sessions also include the last five script lines that ran. Failed sessions also include information about errors that caused scripts to fail.
 to change the data displayed in the widget.
 to view line-by-line details about it in the status tool if it is installed.
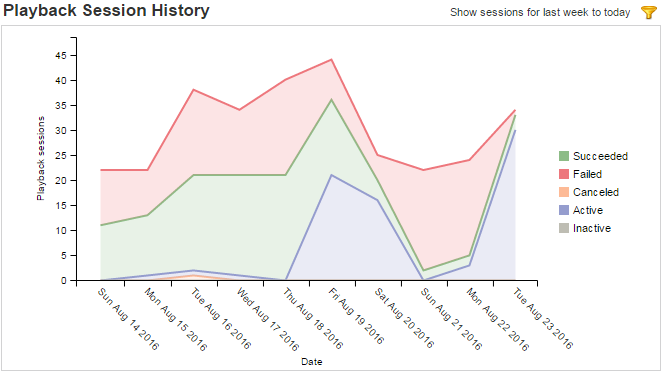
Displays a chart of the number of playback sessions in each run state per day in a date range. Use this widget to view trends in your automated testing efforts and compare how many sessions pass versus fail. For example, you can use this information to determine if adequate testing is complete before a product is ready to release.
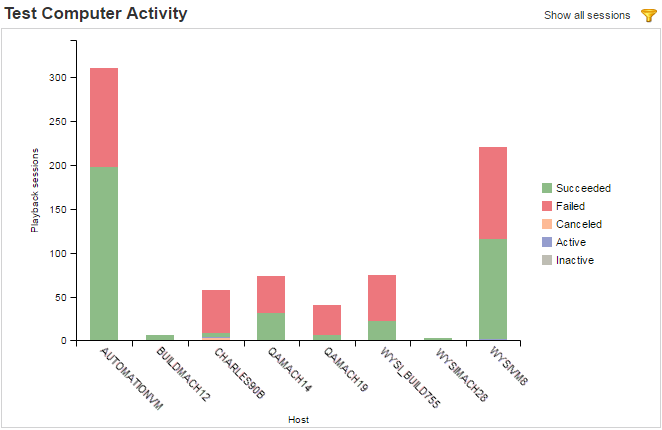
to change the data displayed in the widget.Displays a chart of the number of playback sessions in each run state per test computer. Use this widget to see how your automated tests perform on different computer configurations. For example, you can use this information to determine if adjustments to the product system requirements are needed for an upcoming release.
to change the data displayed in the widget.
    |

|